Tested using Chrome 102.0.5005.61 (runtime settings).
| Metric | Value |
|---|---|
| Page metrics | |
| Performance score | 96 |
| Total page size | 156.3 KB |
| Requests | 11 |
| Timing metrics | |
| TTFB | 83 ms |
| First Paint | 172 ms |
| Fully Loaded | 354 ms |
| Google Web Vitals | |
| TTFB | 83 ms |
| First Contentful Paint (FCP) | 175 ms |
| Largest Contentful Paint (LCP) | 382 ms |
| Cumulative Layout Shift (CLS) | 0.00 |
| Total Blocking Time | 18 ms |
| Max Potential FID | 68 ms |
| CPU metrics | |
| CPU long tasks | 1 |
| CPU last long task happens at | 257 ms |
| Visual Metrics | |
| First Visual Change | 200 ms |
| Speed Index | 262 ms |
| Visual Complete 85% | 400 ms |
| Visual Complete 99% | 400 ms |
| Last Visual Change | 400 ms |
Use--filmstrip.showAll to show all filmstrips.
 0 s
0 s 0.2 sFirst Contentful Paint 175 msuserTimingHeader 185 msFirst Visual Change 200 ms0.3 suserTimingFooter 213 msDOM Content Loaded Time 218 msPage Load Time 222 msCPU Long Task duration 68 msLayout Shift 0.00037 297 ms
 0.4 sFully Loaded 354 msLCP <IMG> 382 msLast Visual Change 400 msVisual Complete 85% 400 msVisual Complete 95% 400 msVisual Complete 99% 400 ms
The coach helps you find performance problems on your web page using web performance best practice rules. And gives you advice on privacy and best practices.

| Title | Advice | Score |
|---|---|---|
| Avoid slowing down the critical rendering path (avoidRenderBlocking) | The page has 3 blocking requests and 0 in body parser blocking (2 JavaScript and 1 CSS). | 80 |
| Description: The critical rendering path is what the browser needs to do to start rendering the page. Every file requested inside of the head element will postpone the rendering of the page, because the browser need to do the request. Avoid loading JavaScript synchronously inside of the head (you should not need JavaScript to render the page), request files from the same domain as the main document (to avoid DNS lookups) and inline CSS for really fast rendering and a short rendering path. | ||
| Offenders: | ||
| Don't scale images in the browser (avoidScalingImages) | The page has 4 images that are scaled more than 100 pixels. It would be better if those images are sent so the browser don't need to scale them. | 60 |
| Description: It's easy to scale images in the browser and make sure they look good in different devices, however that is bad for performance! Scaling images in the browser takes extra CPU time and will hurt performance on mobile. And the user will download extra kilobytes (sometimes megabytes) of data that could be avoided. Don't do that, make sure you create multiple version of the same image server-side and serve the appropriate one. | ||
| Offenders: | ||
| Inline CSS for faster first render (inlineCss) | The page has both inline CSS and CSS requests even though it uses a HTTP/2-ish connection. If you have many users on slow connections, it can be better to only inline the CSS. Run your own tests and check the waterfall graph to see what happens. | 95 |
| Description: In the early days of the Internet, inlining CSS was one of the ugliest things you can do. That has changed if you want your page to start rendering fast for your user. Always inline the critical CSS when you use HTTP/1 and HTTP/2 (avoid doing CSS requests that block rendering) and lazy load and cache the rest of the CSS. It is a little more complicated when using HTTP/2. Does your server support HTTP push? Then maybe that can help. Do you have a lot of users on a slow connection and are serving large chunks of HTML? Then it could be better to use the inline technique, becasue some servers always prioritize HTML content over CSS so the user needs to download the HTML first, before the CSS is downloaded. | ||
| Have a fast largest contentful paint (largestContentfulPaint) | You can add importance="high" to the image to increase the load priority that is rolling out soon in Chrome. | 95 |
| Description: Largest contentful paint is one of Google Web Vitals and reports the render time of the largest image or text block visible within the viewport, relative to when the page first started loading. To be fast according to Google, it needs to render before 2.5 seconds and results over 4 seconds is poor performance. | ||
| Avoid CPU Long Tasks (longTasks) | The page has 1 CPU long task with the total of 68 ms. The total blocking time is 18 ms . However the CPU Long Task is depending on the computer/phones actual CPU speed, so you should measure this on the same type of the device that your user is using. Use Geckoprofiler for Firefox or Chromes tracelog to debug your long tasks. | 80 |
| Description: Long CPU tasks locks the thread. To the user this is commonly visible as a "locked up" page where the browser is unable to respond to user input; this is a major source of bad user experience on the web today. However the CPU Long Task is depending on the computer/phones actual CPU speed, so you should measure this on the same type of the device that your user is using. To debug you should use the Chrome timeline log and drag/drop it into devtools or use Firefox Geckoprofiler. | ||
| Offenders: | ||
Your best practice score is perfect!
Your privacy score is perfect!
| Page info | |
|---|---|
| Title | Welcome to the wonderful world of Web Performance |
| Width | 1350 |
| Height | 4022 |
| DOM elements | 370 |
| Avg DOM depth | 8 |
| Max DOM depth | 13 |
| Iframes | 0 |
| Script tags | 4 |
| Local storage | 0 b |
| Session storage | 0 b |
| HTML vs AMP | Plain good HTML page |
Data collected using Wappalyzer. Use --browsertime.firefox.includeResponseBodies htmlor --browsertime.chrome.includeResponseBodies htmlto help Wappalyser find more information about technologies used.
| Technology | Confidence | Category |
|---|---|---|
| Netlify | 100 | PaaS CDN |
| Clipboard.js 2.0.4 | 100 | Miscellaneous |
| Visual Metrics | |
|---|---|
| First Visual Change | 200 ms |
| Speed Index | 262 ms |
| Visual Complete 85% | 400 ms |
| Visual Complete 95% | 400 ms |
| Visual Complete 99% | 400 ms |
| Last Visual Change | 400 ms |
| Visual Readiness | 200 ms |
| Navigation Timing | |
|---|---|
| backEndTime | 83 ms |
| domContentLoadedTime | 218 ms |
| domInteractiveTime | 213 ms |
| domainLookupTime | 12 ms |
| frontEndTime | 119 ms |
| pageDownloadTime | 19 ms |
| pageLoadTime | 222 ms |
| redirectionTime | 0 ms |
| serverConnectionTime | 42 ms |
| serverResponseTime | 39 ms |
| Google Web Vitals | |
|---|---|
| Time to first byte (TTFB) | 83 ms |
| First Contentful Paint (FCP) | 175 ms |
| Largest Contentful Paint (LCP) | 382 ms |
| Cumulative Layout Shift (CLS) | 0.00 |
| Total Blocking Time (TBT) | 18 ms |
| Extra timings | |
|---|---|
| TTFB | 83 ms |
| First Paint | 172 ms |
| Load Event End | 222 ms |
| Fully loaded | 354 ms |
| User Timing marks | |
|---|---|
| userTimingHeader | 185 ms |
| userTimingFooter | 213 ms |
| User Timing measures | ||
|---|---|---|
| Name | Start time | Duration |
| exampleMeasurement | 185 ms | 28 ms |
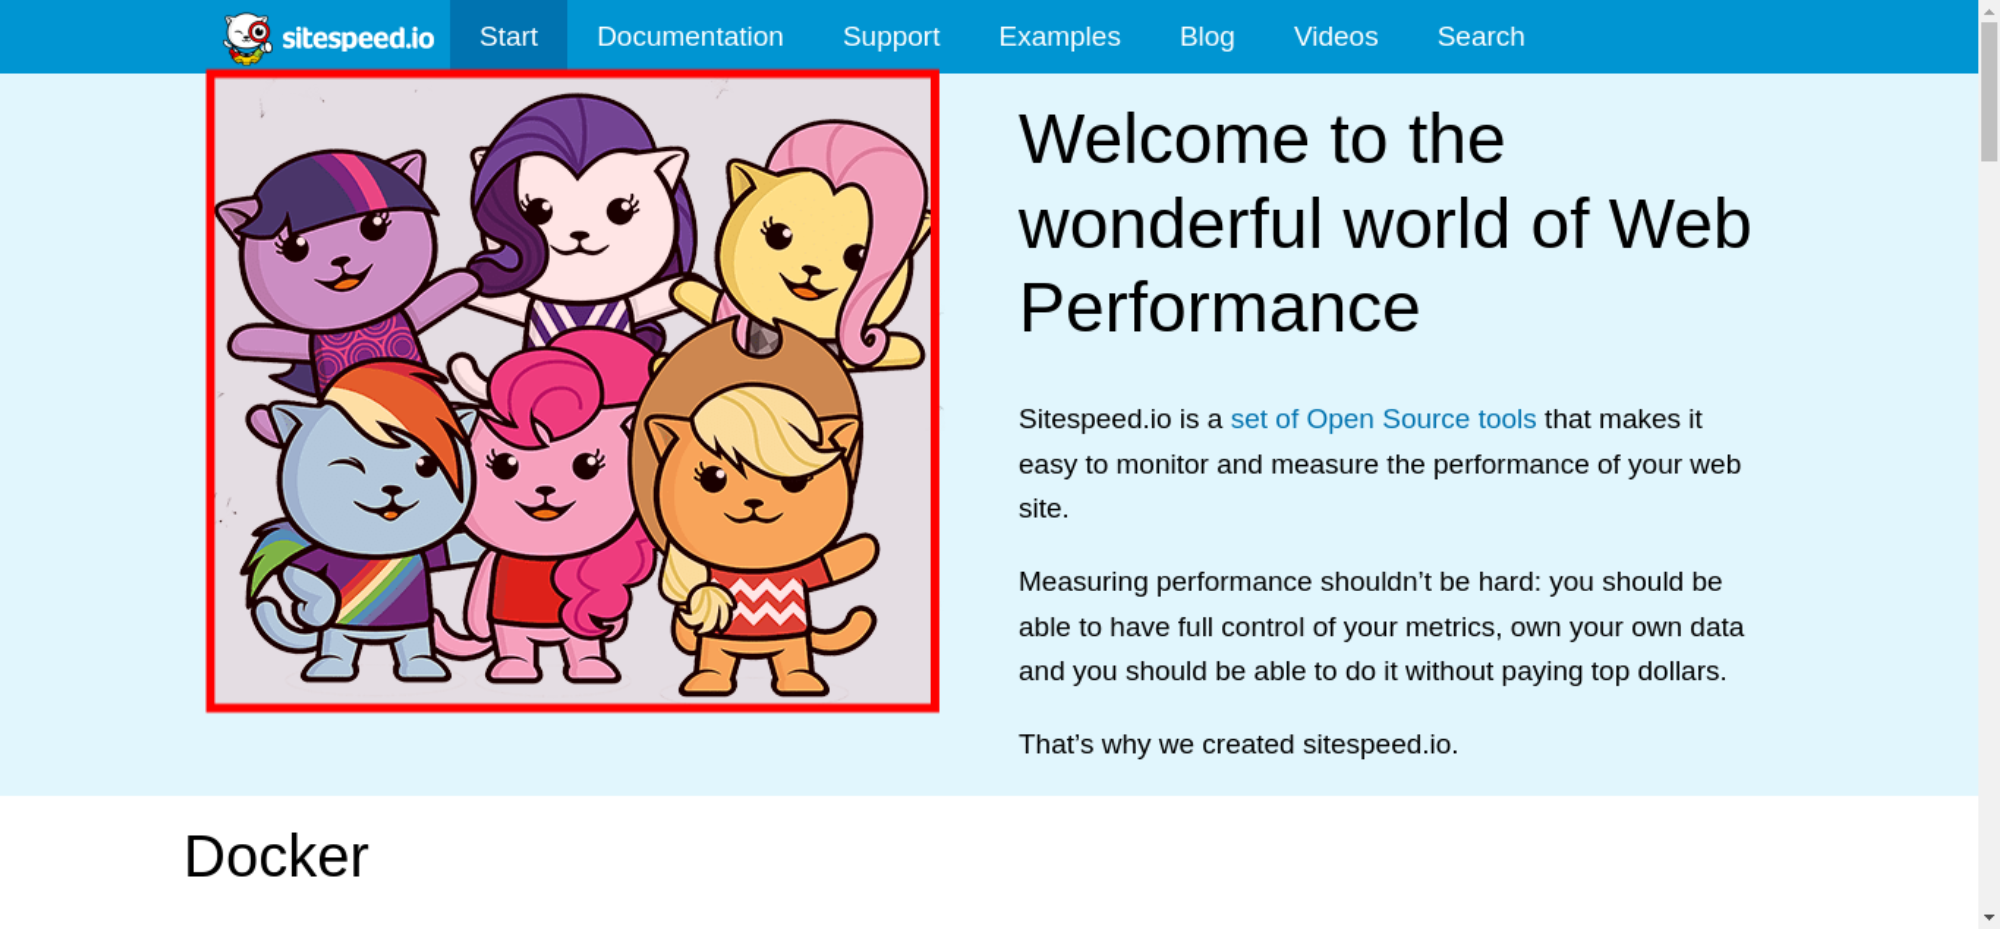
When in time the page main content is rendered (collected using the Largest Contentful Paint API). Read more about Largest Contentful Paint.
| Element type | IMG |
| Element/tag | <img src="/img/team.png" alt="sitespeed.io Logo with My Little Pony style cats" elementtiming="logo"> |
| Render time | 382 ms |
| Load time | 220 ms |
| URL | https://www.sitespeed.io/img/team1px.png |
| Size (width*height) | 216500 |
| DOM path | |
| main > div:eq(0) > div > div:eq(0) > picture > img> main > div:eq(0) > div > div:eq(0) > picture > img> | |

The largest contentful paint is highlighted in the image. If no element is highlighted the element was removed before the screenshot or the LCP API couldn't find the element.
The Largest Contentful Paint API highlighted this image as a part of the LCP.
0.00037 cumulative layout shift collected from the Cumulative Layout Shift API.
These HTML elements contribute most to the Cumulative Layout Shifts of the page. The higher score, the more layout shift.
| Score | HTML Element |
|---|---|
| 0.00037 | <div class="grid"></div> |
| body > nav > div > div | |

The elements that have shifted place is highlighted in the image (that have a higher value than 0.01). If the element shifted outside of the viewport, you will not see it there. It can be hard to understand what content that has shifted, if that's the case, checkout the video or the filmstrip of the run.
| Id | URL | Image | Tag | Render time | Load time | Natural width | Natural height |
|---|---|---|---|---|---|---|---|
| header-logo | https://www.sitespeed.io/img/sitespeed-logo-2c.png | | IMG | 172 ms | 157 ms | 324 | 100 |
| logo | https://www.sitespeed.io/img/team1px.png | | IMG | 382 ms | 220 ms | 500 | 433 |
There are no Server Timings.
There are no custom configured scripts.
There are no custom extra metrics from scripting.
| name | value |
|---|---|
| AudioHandlers | 0 |
| Documents | 4 |
| Frames | 1 |
| JSEventListeners | 4 |
| LayoutObjects | 647 |
| MediaKeySessions | 0 |
| MediaKeys | 0 |
| Nodes | 699 |
| Resources | 10 |
| ContextLifecycleStateObservers | 5 |
| V8PerContextDatas | 4 |
| WorkerGlobalScopes | 0 |
| UACSSResources | 0 |
| RTCPeerConnections | 0 |
| ResourceFetchers | 4 |
| AdSubframes | 0 |
| DetachedScriptStates | 3 |
| ArrayBufferContents | 1 |
| LayoutCount | 6 |
| RecalcStyleCount | 5 |
| LayoutDuration | 53 |
| RecalcStyleDuration | 5 |
| DevToolsCommandDuration | 23 |
| ScriptDuration | 30 |
| V8CompileDuration | 1 |
| TaskDuration | 279 |
| TaskOtherDuration | 166 |
| ThreadTime | 0 |
| ProcessTime | 0 |
| JSHeapUsedSize | 2997508 |
| JSHeapTotalSize | 3620864 |
| FirstMeaningfulPaint | 382 |
How the page is built.
| Summary | |
|---|---|
| HTTP version | HTTP/2.0 |
| Total requests | 11 |
| Total domains | 1 |
| Total transfer size | 156.3 KB |
| Total content size | 201.0 KB |
| Responses missing compression | 4 |
| Number of cookies | 0 |
| Third party cookies | 0 |
| Requests per response code | |
|---|---|
| 200 | 11 |
| URL | Type | Transfer Size | Content Size |
|---|---|---|---|
| https://www.sitespee...shboard-front.png | image | 51.4 KB | 51.3 KB |
| https://www.sitespeed.io/img/team1px.png | image | 49.2 KB | 49.1 KB |
| https://www.sitespeed.io/img/public.png | image | 12.8 KB | 12.7 KB |
| https://www.sitespeed.io/img/pippi.png | image | 10.8 KB | 10.6 KB |
| https://www.sitespeed.io/ | html | 9.1 KB | 35.7 KB |
| https://www.sitespee.../sitespeed.io.ico | favicon | 6.5 KB | 6.4 KB |
| https://www.sitespee.../js/prism-1.15.js | javascript | 6.4 KB | 16.2 KB |
| https://www.sitespee...speed-logo-2c.png | image | 3.6 KB | 3.5 KB |
| https://www.sitespee...oard-2.0.4.min.js | javascript | 3.4 KB | 10.5 KB |
| https://www.sitespee...lack-logo-120.png | image | 1.7 KB | 1.6 KB |
| https://www.sitespee...ss/prism-1.15.css | css | 1.4 KB | 3.5 KB |
| Content | Header Size | Transfer Size | Content Size | Requests |
|---|---|---|---|---|
| html | 0 b | 9.1 KB | 35.7 KB | 1 |
| css | 0 b | 1.4 KB | 3.5 KB | 1 |
| javascript | 0 b | 9.8 KB | 26.7 KB | 2 |
| image | 0 b | 129.5 KB | 128.9 KB | 6 |
| favicon | 0 b | 6.5 KB | 6.4 KB | 1 |
| Total | 0 b | 156.3 KB | 201.0 KB | 11 |
| Domain | Total download time | Transfer Size | Content Size | Requests |
|---|---|---|---|---|
| www.sitespeed.io | 537 ms | 156.3 KB | 201.0 KB | 11 |
| type | min | median | max |
|---|---|---|---|
| Expires | 0 seconds | 6 weeks | 6 weeks |
| Content | Transfer Size | Requests |
|---|---|---|
| html | 0 b | 0 |
| css | 0 b | 0 |
| javascript | 0 b | 0 |
| image | 0 b | 0 |
| font | 0 b | 0 |
| favicon | 6.5 KB | 1 |
| Total | 6.5 KB | 1 |
Includes requests done after onLoad.
| Content | Transfer Size | Requests |
|---|---|---|
| html | 0 b | 0 |
| css | 0 b | 0 |
| javascript | 0 b | 0 |
| image | 0 b | 0 |
| font | 0 b | 0 |
| favicon | 6.5 KB | 1 |
| Total | 6.5 KB | 1 |
Render blocking information directly from Chrome.
| Blocking | In body parser blocking | Potentially blocking |
|---|---|---|
| 3 | 0 | 0 |
| URL | Type |
|---|---|
| https://www.sitespee.../js/prism-1.15.js | blocking |
| https://www.sitespee...oard-2.0.4.min.js | blocking |
| https://www.sitespee...ss/prism-1.15.css | blocking |
Third party requests categorised by Third party web.
Calculated using .*sitespeed.* (use --firstParty to configure).
| Content | Header Size | Transfer Size | Content Size | Requests |
|---|---|---|---|---|
| html | 0 b | 9.1 KB | 35.7 KB | 1 |
| css | 0 b | 1.4 KB | 3.5 KB | 1 |
| javascript | 0 b | 9.8 KB | 26.7 KB | 2 |
| image | 0 b | 129.5 KB | 128.9 KB | 6 |
| font | 0 b | 0 b | 0 b | 0 |
| favicon | 0 b | 6.5 KB | 6.4 KB | 1 |
| Total | N/A | 156.3 KB | 201.0 KB | 11 |
| Content | Header Size | Transfer Size | Content Size | Requests |
|---|---|---|---|---|
| html | 0 b | 0 b | 0 b | 0 |
| css | 0 b | 0 b | 0 b | 0 |
| javascript | 0 b | 0 b | 0 b | 0 |
| image | 0 b | 0 b | 0 b | 0 |
| font | 0 b | 0 b | 0 b | 0 |
| Total | N/A | N/A | N/A |

afterPageCompleteCheck.png

layoutShift.png
largestContentfulPaint.png